1 Superposition Analysis Method Discussion 2002-2008 "Technical Guidelines for Environmental Impact Assessment Atmospheric Environment" stipulates that the final environmental impact after the completion of the project = new pollution source prediction value + current monitoring value - reduction of the calculated value of the pollution source - calculated value of the replaced pollution source. For newly-built projects, the air quality in the assessment area after the completion of the project is a direct result of the project's predicted emission of pollutants discharged from the project and the current monitoring value. Although there is an error in the prediction results, the calculated concentration is often too large. The results are more conservative, and it is beneficial to protect the environmental quality in the assessment area, and there will be no case of “negative concentration†that does not conform to the objective laws.
In the technological transformation project, because the air quality prediction in the assessment area is obtained by subtracting the predicted result reduction from the current monitoring value, if there is a very large reduction in atmospheric pollutants, a negative concentration may occur. Situation. The main reason is that the model recommended by the HJ 2002-2008 guidelines adopts one-year or three-year observations of meteorological data for prediction. The forecast results are predicted values ​​under the most unfavorable meteorological conditions in long-term meteorology, and the current status is monitored. For 5-7 consecutive days of monitoring value. Due to the different meteorological conditions during the prediction and monitoring, the predicted value and the actual monitoring value will be greatly deviated, and even result in the occurrence of negative values ​​at some evaluation points after the superposition.
2 Overlay analysis of forecast results under different meteorological conditions In the following, combined with actual work, the forecast model ADMS recommended by the 2002-2008 guideline is adopted, and the atmospheric environmental impact assessment of a steel complex enterprise technological transformation project is taken as an example to predict the results under different meteorological conditions. Overlay analysis.
2.1 Introduction to the ADMS Model The ADMS model couples the latest developments in atmospheric boundary layer research. Conventional meteorological elements are used to determine the boundary layer structure. Only the conventional meteorological parameters need to be input in the model calculation to make the pollutant concentration calculation result more accurate. More credible, it can better describe the atmospheric diffusion process. A significant difference between the ADMS model and other large diffusion models is that the latest theory of the length and boundary structure of Moniu-Obukhov is used to precisely define boundary layer feature parameters. The ADMS model discards the Pasquil temperature classification and the Gaussian model, and uses the PDF model and the small-wind convection model. ADMS is suitable for rural or urban areas, simple or complex terrain.
2.1.1 Basic Calculation Formulas 2.1.1.1 PDF Mode Under low-buoyancy conditions, Weil (1984)'s PDF model is used to calculate ground concentration for low buoyancy plume.
2.1.1.2 Small wind convective scale model Under unstable conditions, the small wind convective scale model of Briggs (1985) is used for high buoyancy plume.
2.1.1.3 The Loft model uses the Weil (1991) Loft model for high buoyancy plumes under neutral conditions.
2.2 Application Examples
2.2.1 Parameters of pollution source A technological transformation of the sintering plant of a steelmaking joint enterprise in the Northwest China, a new set of sintering flue gas desulphurization equipment was built. Before and after the technical transformation, the pollution source was discharged. Terrain parameters were SRTM 90 terrain data, and the accuracy was 90 II1×90 m. The topography of the project area is shown in Figure 1.
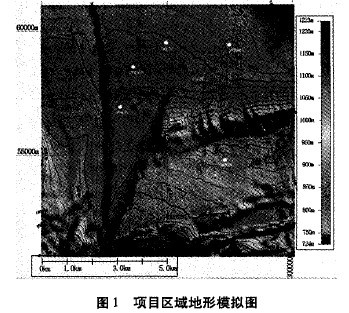
Figure 1 Terrain simulation of the project area
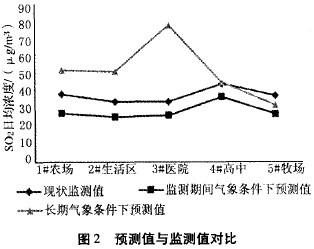
Figure 2 Comparison between predicted and monitored values
Here you can find the related products in TOYOTA Replica Wheels, we are professional manufacturer of TOYOTA Replica Wheels,Replacement Rims,Oem Replica Wheels,20 Inch Tundra Wheels. We focused on international export product development, production and sales. We have improved quality control processes of Toyota Replica Wheels to ensure each export qualified product.
If you want to know more about the products in TOYOTA Replica Wheels, please click the product details to view parameters, models, pictures, prices and other information about Toyota Replica Wheels,Replacement Rims,Oem Replica Wheels,20 Inch Tundra Wheels.
Whatever you are a group or individual, we will do our best to provide you with accurate and comprehensive message about TOYOTA Replica Wheels!
Toyota Replica Wheels,Replacement Rims,Oem Replica Wheels,20 Inch Tundra Wheels
HENAN RACE TRADING CO.,LTD , https://www.hrwheelser.com